New Engen is a performance marketing agency that runs paid campaigns across every channel you can name. Meta, Google, TikTok, CTV, programmatic, Shopify, Klaviyo—24 platforms in total, serving over 100 brands.
The problem wasn’t the advertising. The campaigns were working. The problem was that nobody could see what was happening without spending half their day pulling reports.
Every channel has its own reporting interface. Its own definitions of ROAS, its own attribution windows, its own CSV export quirks. Analysts were spending more time reconciling numbers than analyzing them. Clients wanted fast answers, but getting them meant logging into multiple platforms, exporting data manually, and hoping everything aligned—which it rarely did.
The team wasn’t bad at their jobs. They were stuck in report assembly mode when they should have been doing actual analysis.
The Infrastructure
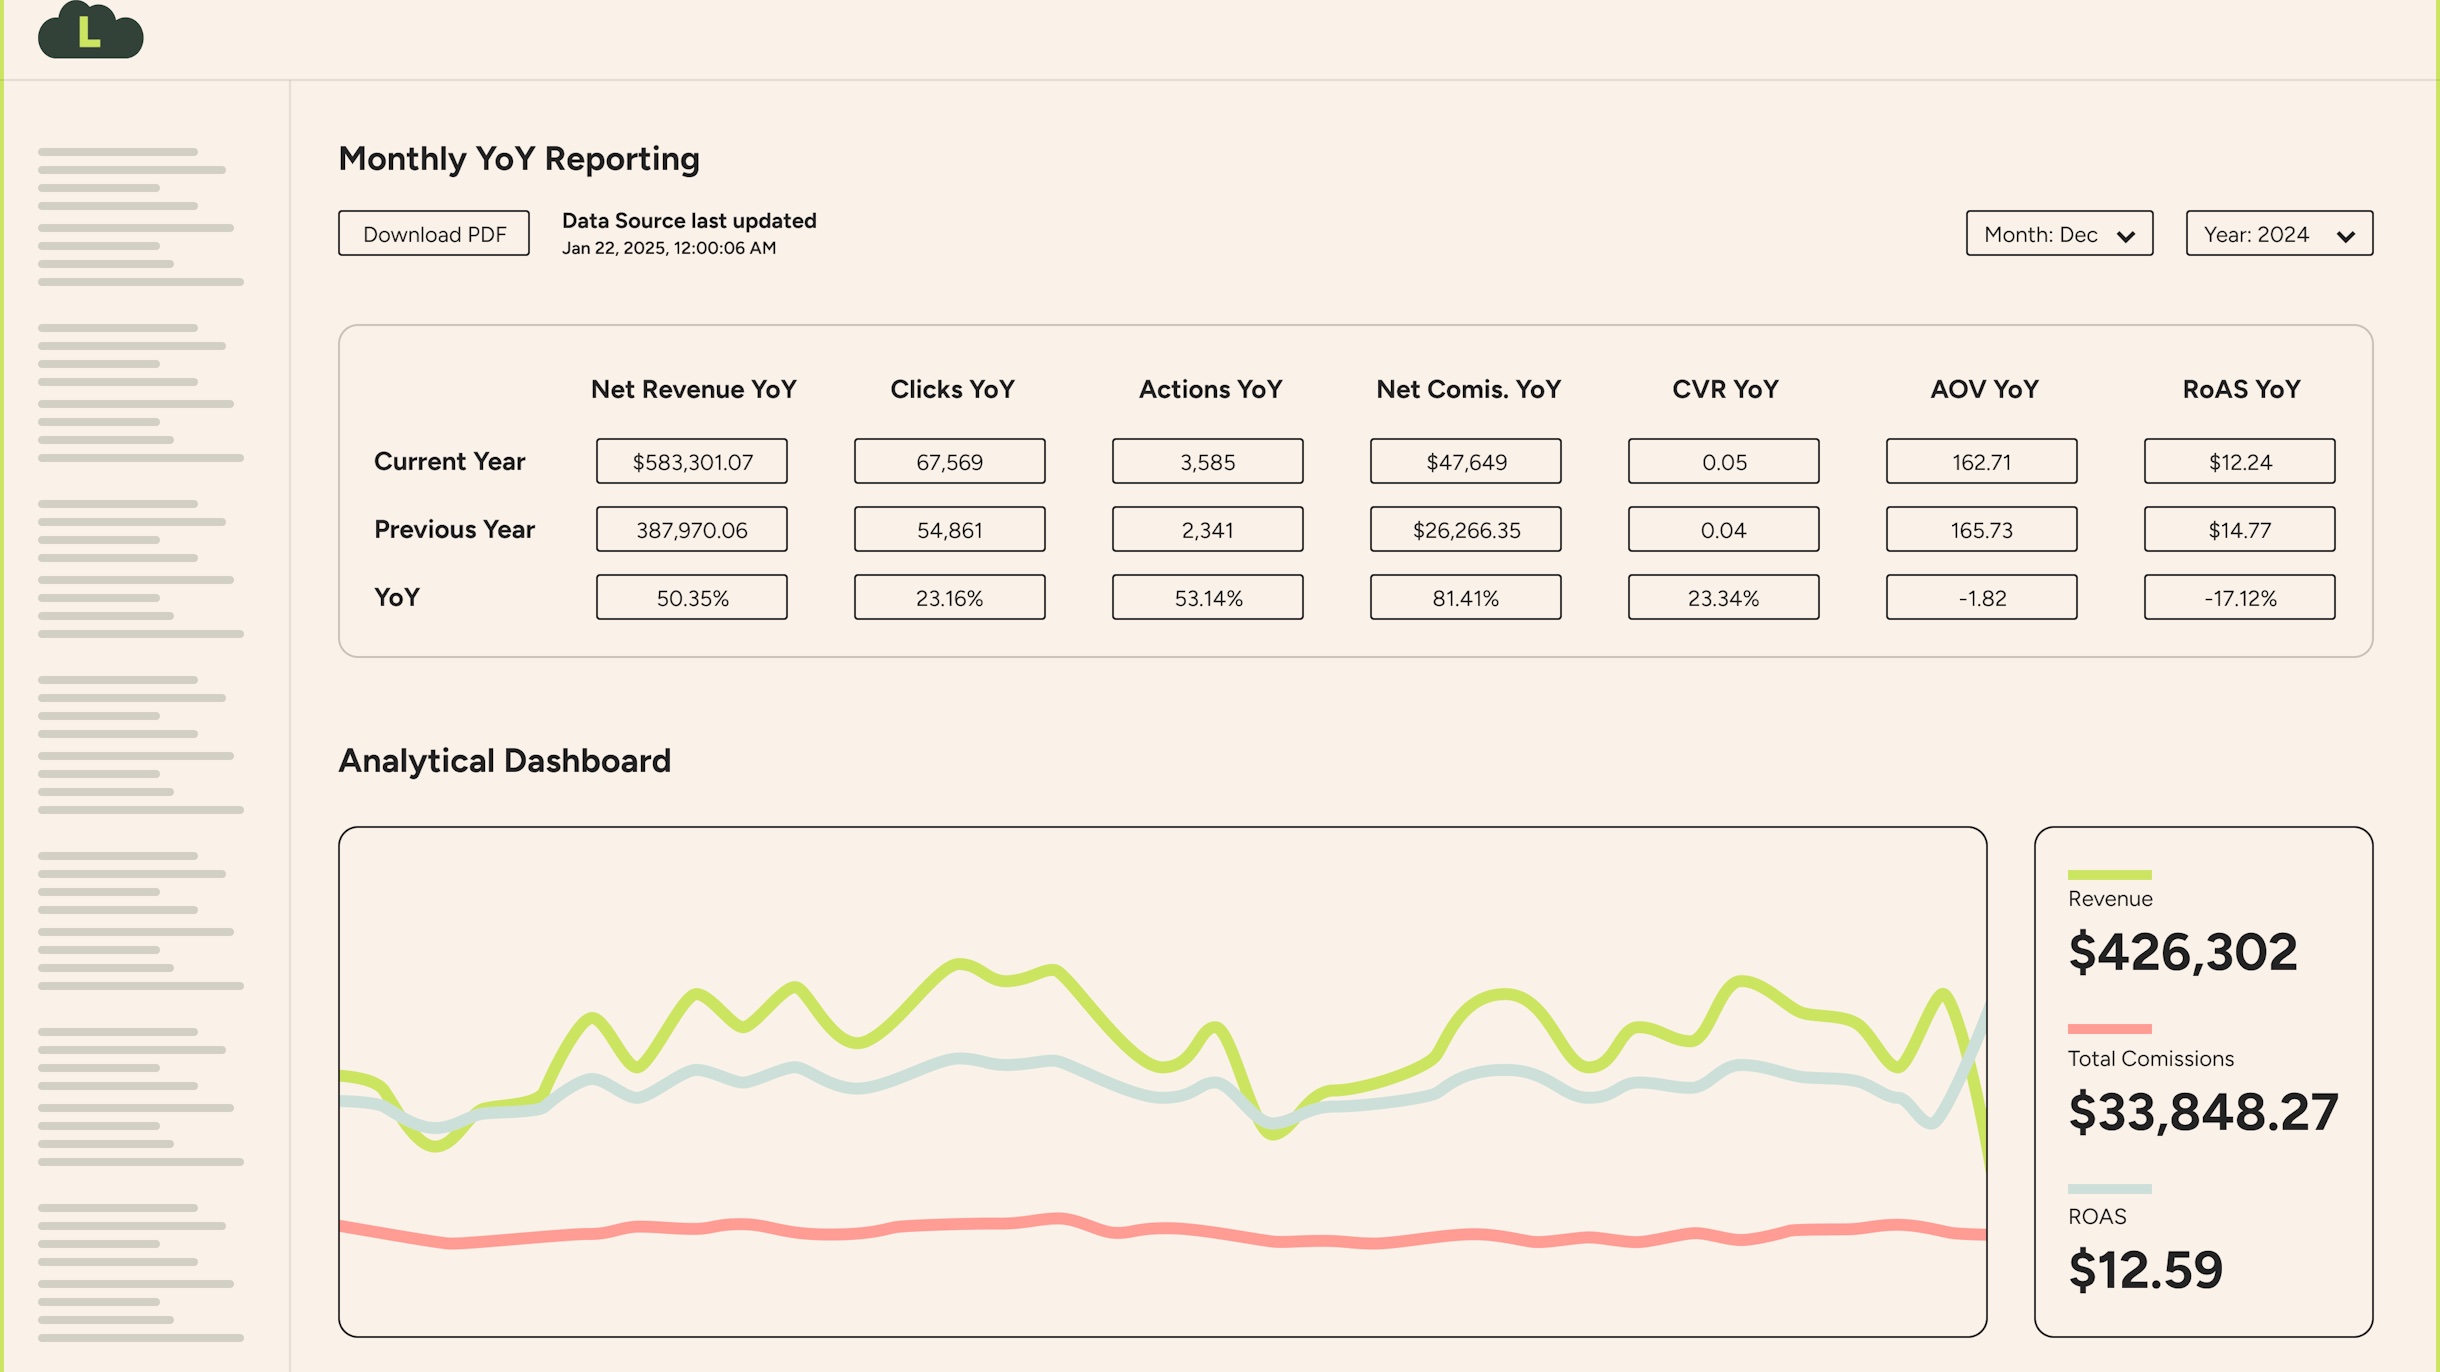
We built the data infrastructure behind New Engen’s LIFT platform—centralized reporting for every client across every channel.
The Data Layer
Everything flows into BigQuery. We built a dbt transformation layer on top that handles cleaning, standardizing, and modeling data from all 24 sources. This is the part that sounds simple but isn’t: getting “revenue” to mean the same thing whether it’s coming from Meta, Google, or Shopify requires careful modeling. Consistent definitions across 24 sources is what makes everything downstream trustworthy.
The Reporting Layer
Once the data is clean and modeled, dashboarding is straightforward. We built client-facing views in Looker Studio on top of BigQuery—one per brand, all pulling from the same governed data models. No more “my numbers don’t match your numbers” conversations.
The AI Layer
This is the part that changes the game. Instead of just showing charts, the system generates written narrative summaries of performance.
Here’s what that looks like in practice. A client used to open a dashboard and see a line going up or down. Now they get something like:
“Meta spend increased 12% week-over-week, but ROAS declined from 4.2x to 3.8x. The drop is concentrated in prospecting campaigns—retargeting held steady at 5.1x. Recommend shifting 15% of prospecting budget to top-performing retargeting audiences.”
The AI drafts it. The account team reviews and adjusts. The client gets a personalized update that actually tells them what to do—not just what happened.
The Scale Factor
Adding a new client used to take weeks of setup. Now it takes hours. New ad channels take days instead of months. The infrastructure was designed to scale horizontally—same models, same pipelines, different data flowing through.
What Changed
Before this infrastructure existed, pulling a weekly performance report took half a day. An analyst would log into platforms one by one, export data, paste it into a spreadsheet, reconcile discrepancies, format the output, and send it over. By the time the client got the report, the data was already stale.
The numbers tell the story. Senior analysts were spending 20–30% of their time just maintaining the data pipeline for a single platform. Multiply that across 24 channels and the math gets ugly fast. Investigating a new data source—figuring out the fields, the gotchas, the naming quirks—used to take a senior analyst three weeks. After we built the standardized dbt layer, integrating a new source takes about five hours.
On the infrastructure side, optimizing the pipeline scheduling alone cut BigQuery costs by 30%. The platform now serves 100+ clients, with 40–60% onboarding through a fully standardized process that requires zero customization. In one recent six-week stretch, the team handled four new client onboardings and sixteen new data sources—the kind of throughput that would have been unthinkable before centralization.
LIFT dashboard adoption has become the key success metric internally, with leadership targeting 90%+ active usage across the client base. The shift isn’t just that clients have dashboards—it’s that they’re building their own views on top of the governed data, creating Tableau workbooks and custom Looker Studio reports because they trust the underlying numbers.
The conversation shifted. Analysts went from answering “what happened last week?” to “what should we do about it?” Client trust went up. Renewals went up. Referrals went up. People could finally see what was working and why.
The Bigger Pattern
This isn’t unique to agencies. The same problem shows up at every company that’s outgrown its spreadsheets but hasn’t built real data infrastructure yet.
Here’s what the fix looks like, regardless of industry:
- A warehouse — One place where all your data lives. Not scattered across platform dashboards and shared spreadsheets that became monsters nobody wants to touch.
- Pipelines — Automated flows that pull data in from every source on a schedule. No more manual exports.
- A modeling layer — dbt or something equivalent, so your metrics actually mean the same thing everywhere.
- Dashboards — Built on top of governed data, not pasted together from CSVs.
- AI narratives — Written summaries that translate numbers into decisions. This is becoming table stakes faster than most people realize.
Where to Start
The best data projects I’ve seen start with one burning question and two weeks of focused work. Not a six-month roadmap. Not a platform buy. Just: what’s the one question your team asks every week that takes too long to answer?
Start there. Build the pipeline to answer that question automatically. Once people see something that used to take four hours answered in real time, the next project sells itself.
New Engen started with exactly that kind of focused approach and ended up with a platform that serves hundreds of clients. The infrastructure grew because the foundation was right—not because someone drew the whole thing on a whiteboard before writing any code.
Centralize. Automate. Add intelligence. In that order.
Working through a similar data challenge? Let’s talk.